Reversal formations
Head & Shoulders, double tops/bottoms, and diamond patterns near volatility extremes.
Price action lab
Markets move in cycles. Pattern definitions are documented with entry criteria and historical reliability so teams can recognize structures earlier.
Head & Shoulders, double tops/bottoms, and diamond patterns near volatility extremes.
Flags, pennants, and rectangles captured during momentum expansions.
Wedges and triangles with breakout probability context for contested liquidity zones.
Trading reversal strategies, identifying M and W formations while avoiding fakeouts.
The classic reversal setup. Learn neckline logic and depth target math.
Trading breakouts from price confinement and volume-backed accumulation.
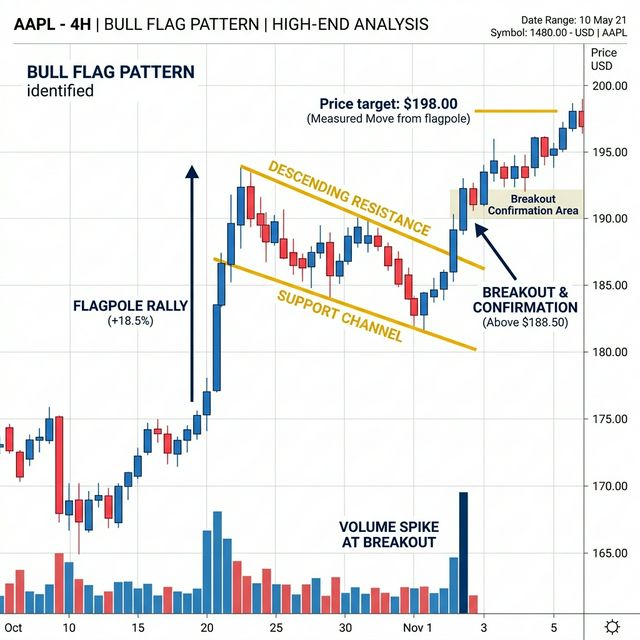
High-probability trend continuations. Master the flagpole and measured move logic.
Identifying institutional exhaustion. Learn why rising wedges are bearish and falling are bullish.
Master the visual language of price. Learn OHLC anatomy and rejection wick psychology.
Spotting momentum shifts. Learn how to trade Bullish and Bearish reversals at key levels.
The ultimate rejection signal. Master the mechanics of Hammers and Shooting Stars.
Trading market equilibrium. Learn the difference between Gravestone and Dragonfly setups.
Advanced three-candle structures. Spot the transition from impulse to reversal confirmation.
Trading the original XABCD pattern. Fibonacci-based reversal zones.
Calculated Fibonacci extensions. 88.6% and 127.2% execution rules.
Drawing accurate market levels. Understanding psychological memory zones.
Institutional order blocks. Trading accumulation and distribution zones.
How to avoid bull and bear traps. Trading against the retail crowd.
A high-probability continuation signal. Target calculation and depth math.
Identifying major bearish reversals with three consecutive candles.
Precision reversal trading based on matching highs and lows.
Absolute momentum trading. Identifying pure market dominance.
Trading expanding volatility. The megaphone pattern and market confusion.
Explosive continuation setups. Trading the flagpole breakout logic.
Trading the box range. Breakout and reversal strategies for ranges.
How to trade this rare reversal. Identifying the broadening diamond.
The ultimate bullish reversal. Converging trendlines and target rules.
Catching explosive moves. Trading volatility contraction cycles.
A rare 3-candle island reversal. Spotting major trend exhaustion.
Calculating exact profit targets using impulsive swing projections.
Bearish reversal strategy. Trading the rejection of a bullish rally.
Spotting symmetrical breakouts. Finding the natural market rhythm.
Trading institutional stop hunts. Superior Head & Shoulders setups.
Catching panic tops. The 3 phrases of speculative acceleration.
Trading the 3-touch reversal. Psychology of buyers failing at resistance.
Spotting major market tops. Trading the exhaustion gap trap.
Catching massive swing trades. Long-term accumulation logic.
Mapping market cycles. Counting impulse and corrective waves.
Extreme Fibonacci extensions. Highly accurate 161.8% reversals.
The ultimate continuation candle. Confirming the trend is far from over.
Trading institutional shocks. The gap-and-go reversal signal.
84% win rate continuation. Trapping sellers for the next move up.
How to trade flash crashes. Catching aggressive panic reversals.
Do all gaps fill? Identify breakaway and exhaustion gaps.
Breakout timing framework using contraction sequencing, pivot triggers, and volume dry-up.
How to trade stop-hunt reversals with reclaim confirmation and structural invalidation.
Related tools: Spread Cost Calculator, Session Overlap Time Tool, and Market vs Limit vs Stop Orders.